Individual: An object described by data
Variable: Characteristic of the individual
Categorical Variable: Places individual into one of several groups or categories.
- Pie charts show the distribution of a categorical variable as a "pie" whose slices are sized by the counts or percents for the categories. All items must be of the same family.
- Bar graphs represent each category as a bar whose heights show the category counts or percents. If there are a lot of items, it is best to use a bar graph.
- Histograms show the distribution of a quantitative variable by using bars whose height represents the number of individuals who take on a value within a particular class.
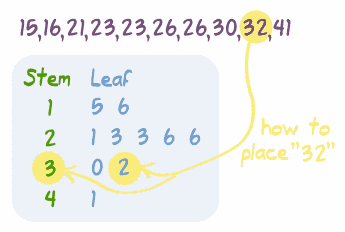
- Stemplots separate each observation into a stem and a leaf that are then plotted to display the distribution while maintaining the original values of the variable.


 6,562.02


