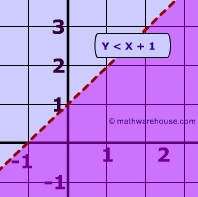
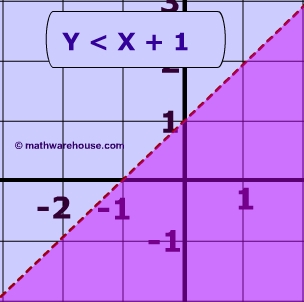
y < x + 1
graph line y = x + 1. choose a point and see if it fits the inequality. if it does, that area gets shaded.
systems of linear inequalities
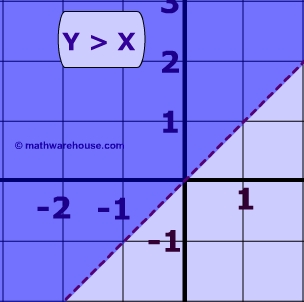
Graph both equations, find where shading overlap.
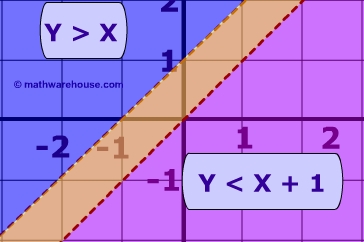
The solution of this system is the yellow region which is the area of overlap.


 6,565.41
 ")
")
")
")
")
")
")
")
")
")
")
")
")
")
")
")
")
")
")
")
")

